





- The Short Version
- GA4 vs Universal Analytics
- Hits vs Events
- Metrics That Changed
- What Happened to UA Data
- Tracking ID vs Measurement ID
- GA4 vs Google Ads
- AdWords vs Analytics
- GA4 vs Search Console
- GA4 vs Adobe Analytics
- Paid vs Free (GA4 360)
- How Long Until GA4 Tracks
- Which Tool Answers Which Question
- FAQ
- References
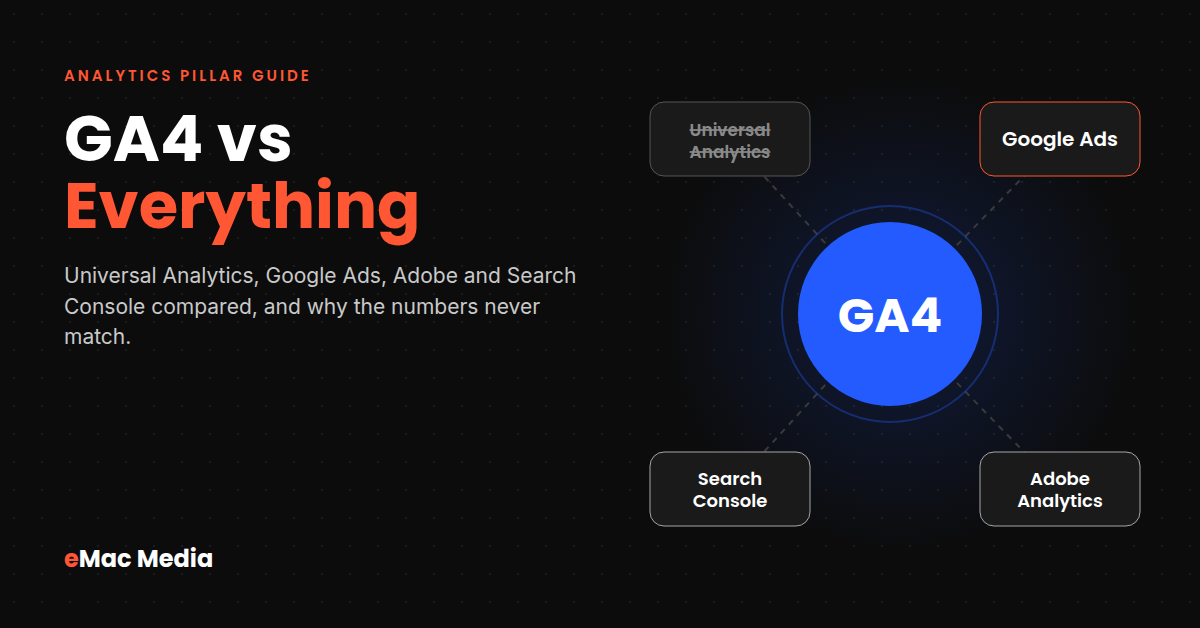
Google Analytics 4 replaced Universal Analytics for good in July 2024, and it counts the world differently: events instead of hits and key events instead of goals. Meanwhile Google Ads, Search Console and Adobe Analytics each report their own version of the truth. This guide lines them all up, explains the settings behind every discrepancy, and covers the practical questions people search for, from finding your Measurement ID to how long GA4 takes to start showing data.
The Short Version
Every tool in this comparison answers a different question. Most reporting fights start when someone expects two of them to agree. Here is the whole article in one table.
| Tool | What it measures | Cost | Trust it for |
|---|---|---|---|
| GA4 | Everything visitors do on your site or app, from every channel | Free (360 is paid) | Cross-channel behavior, funnels, key events |
| Universal Analytics | Sessions and pageviews (retired) | Shut down | Nothing. The data was deleted in July 2024 |
| Google Ads | Clicks and conversions credited to your Google ads | Free to use, you pay for media | Bidding, budget and campaign decisions |
| Search Console | What happens in Google Search before the click | Free | Queries, impressions, rankings, indexing |
| Adobe Analytics | Enterprise web and cross-channel behavior | Custom quote, usually five to six figures a year | Complex journeys with a dedicated analytics team |
The rest of this guide explains each pairing, the settings that cause the numbers to disagree, and the questions we get from clients every week.
Google Analytics 4 vs Universal Analytics
Universal Analytics (UA) ran from 2012 until Google retired it. GA4 was introduced in 2020 and became the only option once UA shut down. Comparing them now is mostly about understanding why your year-over-year charts broke and why old habits give wrong answers in the new interface.
Hits and Sessions vs Events
UA organized data around sessions, with hit types underneath: pageviews, events, transactions and social interactions. Each event needed a category, action and label, and reports assumed the session was the unit that mattered.
GA4 treats everything as an event. A pageview is an event called page_view. A scroll is scroll. A purchase is purchase with parameters for value and currency. Sessions still exist, but GA4 derives them from events rather than the other way around. That model lets one property measure a website and an app together, and it is why GA4 reports feel less like a set of fixed tables and more like a query tool.
Metrics That Changed (and Why Your Numbers Moved)
| Universal Analytics | GA4 equivalent | What to know |
|---|---|---|
| Bounce rate (single-page sessions) | Engagement rate / bounce rate | GA4 bounce rate is the inverse of engagement rate. A session counts as engaged if it lasts 10+ seconds, has a key event or has 2+ pageviews |
| Goals (20 per view) | Key events | Any event can be marked as a key event. GA4 renamed “conversions” to key events in March 2024 |
| Views and filters | Data streams and subproperties | Standard GA4 has no views. Subproperties and rollups require 360 |
| Users (mostly cookie-based) | Total users / active users | GA4 reports active users by default and can use User-ID and Google signals |
| Data kept until you deleted it | 2 or 14 months (explorations) | Retention limits apply to user-level data in explorations. Standard reports keep aggregated data |
Two settings catch most teams. First, GA4 data retention defaults to 2 months. Change it to 14 months under Admin, Data collection and modification, Data retention on day one, because the setting does not apply backward. Second, engagement rate is not a renamed bounce rate. A blog post where readers spend three minutes on one page was a 100% bounce in UA and an engaged session in GA4. When a key landing page shows low engagement in GA4, the cause is usually page layout or load speed, which is a UX design problem rather than a traffic problem.
What Happened to Universal Analytics Data
| Date | What happened |
|---|---|
| July 1, 2023 | Standard UA properties stopped processing new hits (some staged out over the following weeks) |
| July 1, 2024 | UA 360 properties stopped processing, and access to all UA properties and the API ended |
| Week of July 1, 2024 | Google deleted Universal Analytics data. There is no restore option |
If you exported UA reports to Sheets or BigQuery before the shutdown, keep them with a note on how each metric was defined, because they will never line up cleanly against GA4. If you did not export, your historical baseline now starts with your GA4 install date. That is a good reason to get GA4 configured correctly, since every month of clean data you collect now becomes next year’s benchmark for SEO performance and paid campaigns.
Google Analytics Tracking ID vs Measurement ID
This is one of the most searched GA questions, usually by someone pasting an old ID into a new plugin.
| Tracking ID | Measurement ID | |
|---|---|---|
| Belongs to | A Universal Analytics property | A GA4 web data stream |
| Format | UA-12345678-1 | G-XXXXXXXXXX |
| Still works? | No | Yes |
| Where to find it | UA Admin (no longer accessible) | GA4 Admin > Data streams > your web stream |
You may also see IDs that start with GT- or AW-. A GT- ID is a Google tag ID, a container that can route data to GA4 and other Google products at once. AW- IDs belong to Google Ads conversion tags. The property ID (a plain number) identifies your GA4 property in the API and in integrations like Looker Studio, and it is different from the G- measurement ID your site tag uses. If a WordPress plugin or a developer asks for “your Google Analytics ID,” they almost always mean the G- measurement ID. Getting this wrong is the most common reason we see a new website launch go live with zero analytics.
Not sure your GA4 is set up right?
Missing key events, 2-month retention, duplicate tags and unlinked Ads accounts show up in most audits we run. We fix the setup so the data holds up in a budget meeting.
Google Analytics vs Google Ads
Google Ads is an ad platform with measurement attached. GA4 is a measurement platform that happens to integrate with Google Ads. When their conversion numbers disagree, it is usually because each one answers a different question correctly.
Say 100 people submit your contact form this week and 35 of them came through a Google Ads click. GA4’s key events report shows roughly 100 form submissions from all channels. Google Ads shows roughly 35 conversions, the ones its ads get credit for. Nothing is broken. The platforms simply define the population differently.
| Difference | Google Ads | GA4 |
|---|---|---|
| Scope | Only conversions credited to Google Ads | Key events from every channel |
| Conversion date | Date of the ad click | Date the event happened |
| Default lookback | 30 days for clicks | 90 days for most key events, 30 for acquisition events |
| Counting | One per click or every conversion, per action | Event-based, set per key event |
| Attribution | Data-driven or last click, set per action | Data-driven by default, set at property level |
A click on the 21st that converts on the 25th lands on the 21st in Google Ads and on the 25th in GA4. Run a big campaign at the end of a month and the two platforms will disagree about which month it helped. Consent banners and missing cross-domain setup widen the gap further, so a 20 to 30% difference is normal on most accounts we audit.
Our rule: use Google Ads conversion data for bidding and budget decisions, because that is the data its algorithms optimize against. Use GA4 to see how paid search fits alongside organic, email, social and direct. If you need the two to line up, use the Advertising section in GA4, which applies the same attribution approach Google Ads uses.

Google AdWords vs Google Analytics
Google AdWords is the old name for Google Ads. Google rebranded it in 2018, so any “AdWords vs Analytics” guide describes the same split covered above: one tool buys and reports on ad clicks, the other measures what visitors do after they arrive, whatever brought them. If an old tutorial tells you to “link AdWords,” follow it in GA4 under Admin, Product links, Google Ads links.
GA4 vs Google Search Console
Search Console reports what happens before the click in Google Search: impressions, clicks, average position, queries and indexing. GA4 reports what happens after the page loads. They overlap only on organic Google traffic, and even there they count differently.
| Difference | Search Console | GA4 |
|---|---|---|
| Counts | Clicks on search results | Sessions where the tag fired |
| Blocked by consent or ad blockers? | No (Google logs the click) | Yes, unless consent mode models it |
| Time zone | Pacific time, fixed | Your property time zone |
| Freshness | Usually 2 to 3 days behind | Hours for most reports |
| History | 16 months | Aggregates kept; explorations capped by retention |
A visitor who clicks your result and leaves before the page renders counts as a click in Search Console and nothing in GA4. Compare full weeks that are at least four days old, and expect trends to match while totals do not. Linking the two (GA4 Admin, Product links, Search Console links) puts query data inside GA4, which is the fastest way to see which search terms bring engaged visitors and which bring bounces. That view drives most of our content strategy decisions, and it matters more now that AI Overviews count as regular impressions in Search Console.
Two gaps to remember. Clicks from your Google Business Profile listing show up in its own performance report, so local SEO results need both sources. And visitors who arrive through links on other sites appear in GA4 as referral traffic but never in Search Console, which is the main place to measure what link building sends you directly.

Google Analytics vs Adobe Analytics
Adobe Analytics competes with GA4 360, not with free GA4. It has no free tier, and pricing is a custom quote based on server calls and package (from the Select tier up to Ultimate). Published estimates range widely, from around $50,000 a year at entry level to well into six figures.
| GA4 | Adobe Analytics | |
|---|---|---|
| Price | Free (360 from ~$50K/yr) | Custom quote, typically five to six figures |
| Setup time | Days to weeks | Months, usually with an implementation partner |
| Segmentation | Explorations, with sampling above limits | Retroactive, deep segmentation |
| Ad integration | Native with Google Ads, Search Console, BigQuery and Looker Studio | Native with Adobe Experience Cloud |
| Who runs it | A marketer can manage it | Needs a dedicated analytics team |
For the small and mid-sized businesses we work with, the answer is almost always GA4. Adobe earns its cost when an enterprise already runs Adobe Experience Cloud and employs analysts who will use the depth. Buying it without that team produces an expensive tool that nobody queries. The more common failure is an under-configured GA4, which a platform switch will not fix.
Google Analytics Paid vs Free (GA4 vs GA4 360)
GA4 standard is free with no fee for collecting data. Google Analytics 360 is the paid tier, sold through Google or certified resellers with no public price list. Entry contracts are commonly cited at around $50,000 a year, including about 25 million events per month, with usage-based pricing above that.
| Limit | GA4 (free) | GA4 360 |
|---|---|---|
| Data retention (explorations) | Up to 14 months | Up to 50 months |
| Exploration sampling threshold | 10M events per query | Up to 1B events per query |
| Custom dimensions and metrics | 50 per property | 125 per property |
| Key events | 30 | 50 |
| Audiences | 100 | 400 |
| BigQuery daily export | 1M events | Billions of events |
| Subproperties and rollups | No | Yes |
| SLA and support | None | Data freshness SLA, enterprise support |
Most businesses under a few million events a month never touch these limits. The ones that matter first are retention (if you want explorations covering more than 14 months, export to BigQuery instead of upgrading) and the BigQuery daily cap, which high-traffic ecommerce stores can hit. If sampling or the 1M BigQuery cap is not blocking a real decision, spend the $50,000 on implementation and media instead.
Paying for data you can’t use?
We connect GA4, Google Ads and your CRM so every channel reports into one measurement layer, from first click to closed revenue.
How Long Does It Take for Google Analytics to Start Tracking?
GA4 collects data the moment a correctly installed tag fires. What takes time is processing.
| Where you look | Typical delay |
|---|---|
| Realtime report | Under 1 minute |
| DebugView (with debug mode on) | Seconds |
| Intraday data in standard reports | Around 1 hour |
| Standard reports, fully processed | 24 to 48 hours |
| Attribution data | 4 to 8 hours |
| BigQuery daily export | 24 hours after midnight, property time zone |
| Search Console data after linking | 24 to 48 hours |
So a new property that looks empty on day one is normal. A property that shows nothing in Realtime is not. Use this sequence after any install:

Which Tool Answers Which Question
Stop asking which tool is right. Ask which question you are trying to answer.
| Question | Use |
|---|---|
| Which keywords and pages show up in Google, and at what position? | Search Console |
| Which campaigns and keywords should get more budget? | Google Ads |
| How do visitors from every channel behave, and which ones convert? | GA4 |
| Where do leads come from, and which ones close? | GA4 linked to your CRM |
| We run Adobe Experience Cloud and have analysts to staff it | Adobe Analytics or GA4 360 |
The businesses that get value from analytics are the ones that connect these tools rather than argue about them. In our growth diagnostics, the fix is rarely a new platform. It is usually a linked Google Ads account, a Search Console connection, correctly marked key events and a CRM that closes the loop from click to revenue.
Frequently Asked Questions
References & Sources
- 1[UA] Universal Analytics is going away · Google Analytics Help
- 2[GA4] Data freshness · Google Analytics Help
- 3[GA4] Features with non-standard data processing · Google Analytics Help
- 4Google turns off Universal Analytics July 1: What you need to know · Search Engine Land
- 5Universal Analytics still processing data two months after sunset · Search Engine Land
- 6Google Ads vs Google Analytics 4 Conversions: Which to Use? · MeasureSchool
- 7GA4 Key Events vs Google Ads Conversions: Why They Differ · Seresa
- 8Google Search Console vs Google Analytics 4 · MeasureSchool
- 9Search Console vs GA4 Numbers Differ? Why They Never Match · Zenweb
- 10Google Analytics vs Adobe Analytics: Key Differences, Pricing & Which to Choose · Relevant Audience
- 11Google Analytics Pricing (Free vs 360) · Analytify
- 12How much does Google Analytics actually cost? · PostHog
- 13GA360 vs GA4: A Guide · Optizent
- 14What does Google Analytics 4 really cost? · GA4 Auditor


Want Numbers You Can Actually Trust?
We audit GA4, Google Ads and Search Console setups and connect them into one measurement layer, so every dollar traces back to revenue.
Get Your Free Strategy Proposal